At its core, a Gantt chart is a visual way to plan, schedule, and track a project’s timeline. It takes what could be a messy, complex list of tasks and turns it into a clear, horizontal bar chart. This shows exactly what needs doing, when it needs to happen, and who's responsible. This visual roadmap is indispensable for managing deadlines and dependencies from start to finish.
Visualising Your Project's Journey
Imagine you're running post-production on a major film. You've got visual effects, sound design, colour grading, and the final delivery all happening at once. Trying to juggle that with a simple to-do list? It would be pure chaos. This is precisely where a Gantt chart comes in, transforming that overwhelming checklist into an organised, time-based plan. Think of it as the director's storyboard for the entire project workflow.
In a Gantt chart, every single task is laid out as a horizontal bar against a calendar. The length of that bar shows how long the task should take, making it incredibly easy to see the project's entire scope at a glance. You can immediately spot start dates, end dates, and how different jobs overlap or rely on each other. For example, you can't start the ‘Colour Grading’ until ‘VFX Integration’ is complete. This dependency is marked clearly, helping you head off bottlenecks before they ever become a problem.
This simple but powerful structure gives you a few key advantages right away:
- Clarity on Deadlines: Instantly see when each phase of the project is scheduled to begin and end.
- Understanding Dependencies: Visualise how tasks are connected, making sure work gets done in the right order.
- Tracking Progress: See in real-time how the project is moving along compared to the original schedule.
- Improved Communication: It acts as the single source of truth for your entire team, stakeholders, and clients.
A Gantt chart does more than just list tasks; it tells the story of your project over time. It shows the rhythm, the connections, and the critical path to success, making it an indispensable tool for keeping complex work on track.
Ultimately, understanding what a Gantt chart is used for comes down to seeing its role in effective project planning. It's not just about setting a schedule; it’s about building a dynamic, visual guide that helps your team navigate from concept to completion with confidence and clarity.
The Anatomy of a Modern Gantt Chart
To really get what a Gantt chart is used for, you first need to understand its essential building blocks. Think of it like a film production; individual shots, scenes, and characters all come together to tell a cohesive story. In the same way, a Gantt chart combines a few key components to create a clear, dynamic project narrative that everyone on the team can follow.
Each part has a distinct role in bringing the project timeline to life. Let’s move beyond simple definitions and explore how these elements actually function in a creative workflow. They work in tandem to transform a static to-do list into an interconnected, visual plan.
At the heart of any Gantt chart is the project timeline itself. This horizontal axis, usually marked in days, weeks, or months, provides the basic structure for everything else. It’s the canvas for your project’s story.
Core Visual Components
Visualising the project management timeline is all about clarifying the relationship between planning, scheduling, and tracking what needs to get done.
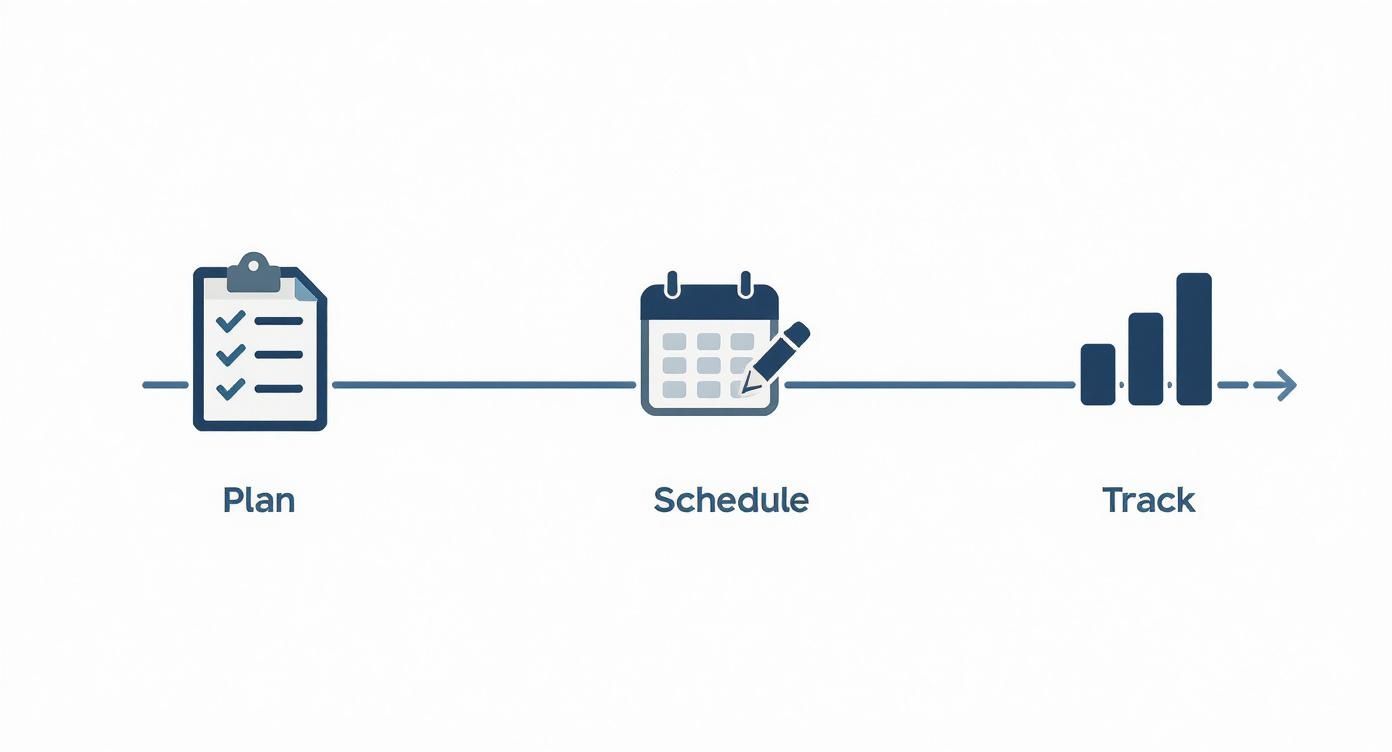
This graphic shows how a project moves logically from one phase to the next—a flow that Gantt charts are brilliant at representing. Let's break down the individual elements that make this happen.
Taskbars: These are the horizontal bars that give the chart its signature look. Each bar represents a specific task, like ‘VFX Integration’ or ‘Sound Mix’. The length of the bar instantly tells you how long that task will take, from its start date to its end date.
Milestones: Not every important event takes time. Milestones are single points on the timeline marking critical achievements or deadlines, like ‘Client Review’ or ‘Final Edit Approved’. They’re often shown as diamond shapes and act as signposts to track your progress.
Dependencies: This is where the chart’s real power comes in. Dependencies are the lines connecting tasks, showing which jobs must be finished before others can even start. For example, the ‘Colour Grading’ task can’t kick off until the ‘VFX’ task is complete. This creates a logical chain reaction across the entire project.
Bringing the Plan Together
These components don't just exist in isolation. They're layered on top of each other to create a rich, informative picture of the whole project. Taskbars show the work, milestones mark the progress, and dependencies reveal the critical path your team has to follow.
By combining these elements, a Gantt chart gives you an at-a-glance understanding of not just what needs to be done, but how all the pieces fit together over time. It’s a complete script for project execution.
For a post-production studio, this means you can instantly see how a delay in one department—say, animation—will ripple through the schedule and impact the final delivery date. This visual foresight is exactly what a Gantt chart is used for; it empowers teams to spot challenges early and adjust their plans proactively, making sure the final cut gets delivered on time and on budget.
Gantt Charts in Action for Creative Studios
Theory is one thing, but seeing how a Gantt chart is used in the high-stakes world of post-production really brings its value to life. Creative studios operate under immense pressure, juggling multiple teams, tight deadlines, and complex, interconnected workflows. Here, a Gantt chart isn't just another management tool; it's the operational heartbeat of the entire project.
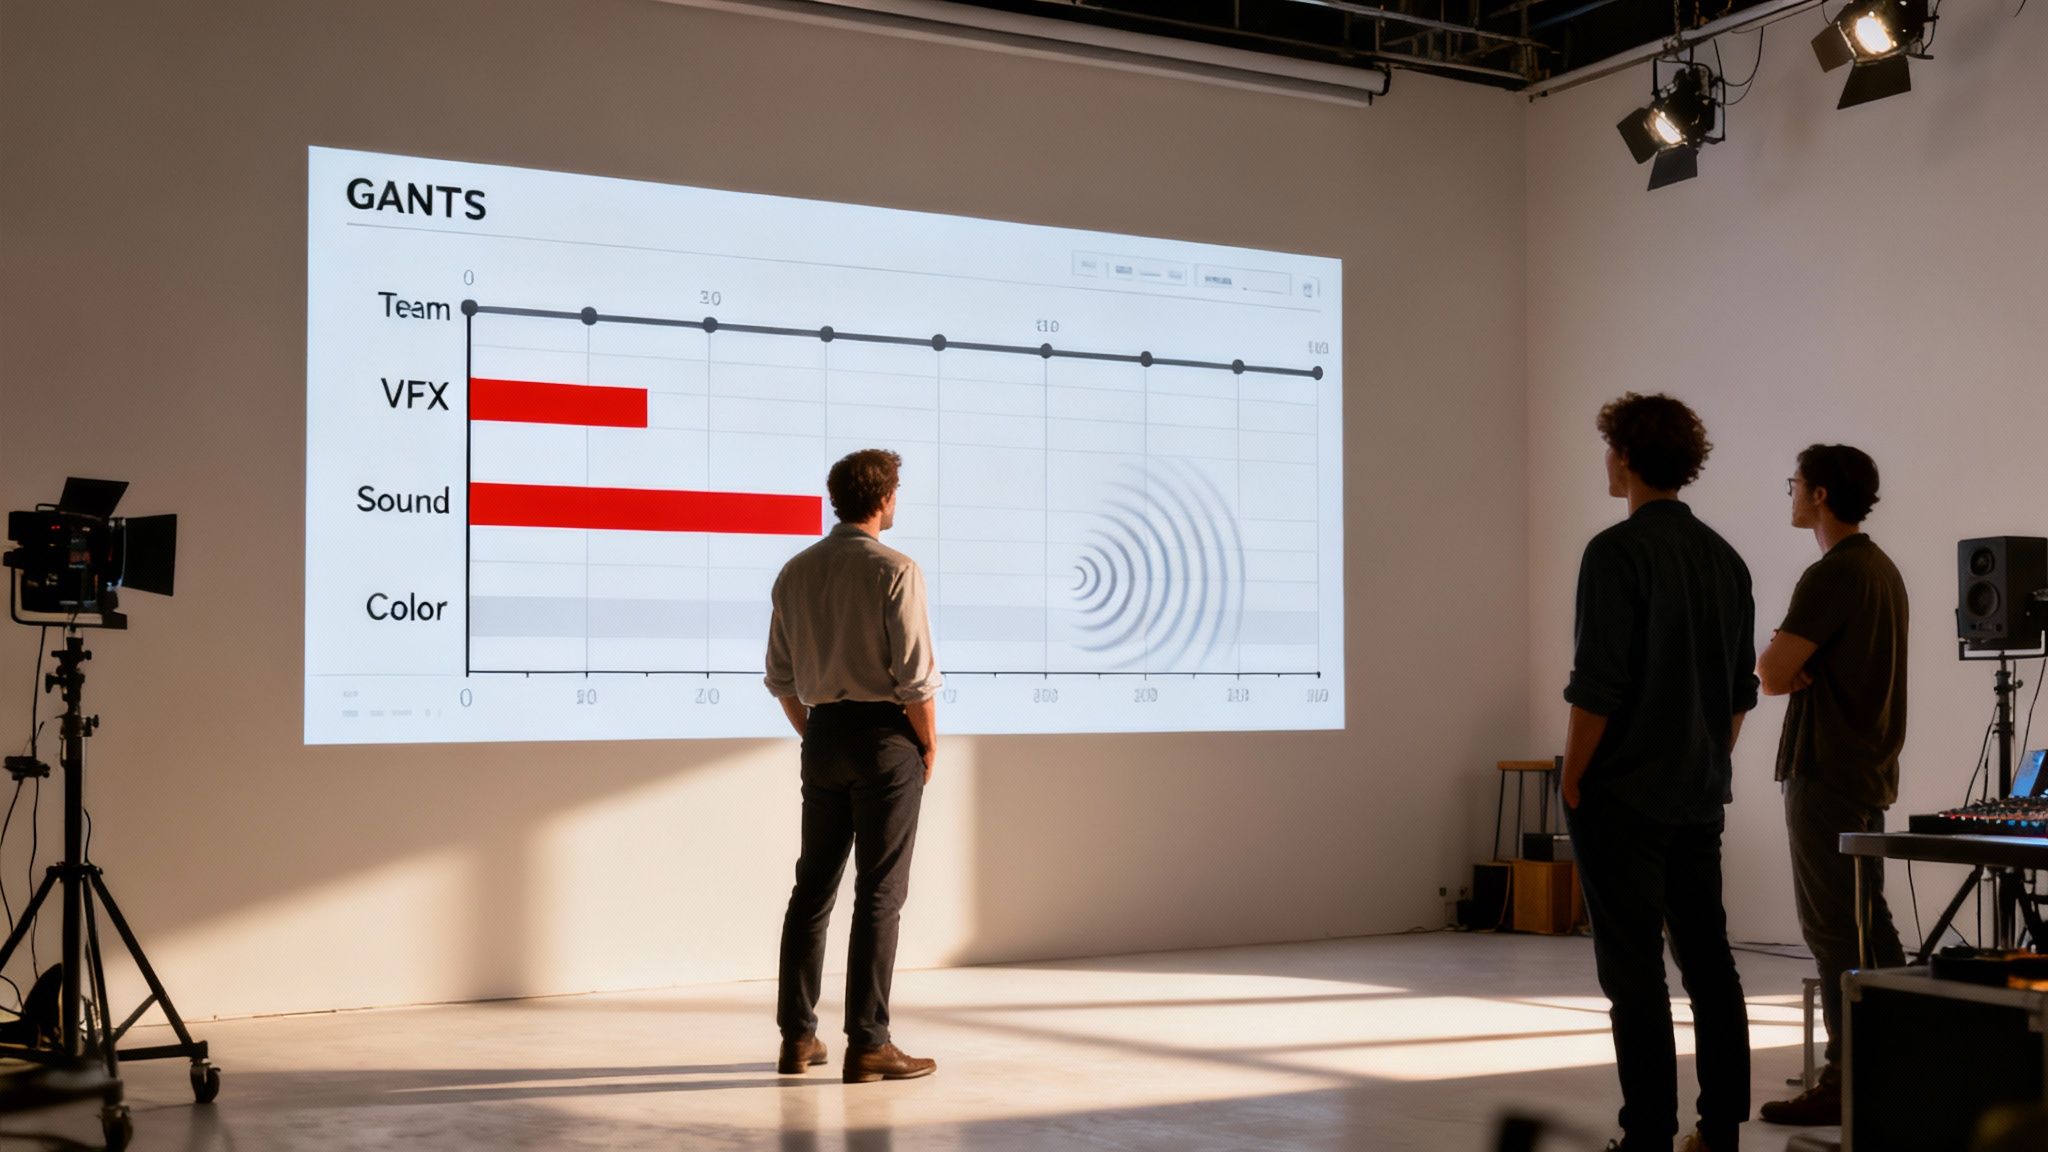
Just picture a visual effects studio working on a blockbuster film. You've got dozens of artists, from modellers to compositors, who all need to complete their work in a very specific sequence. A Gantt chart acts as the visual command centre for the whole operation, mapping out every single stage from the first concept to the final render.
Managing Complex Post-Production Workflows
In any studio, resource management is a constant headache. You have highly specialised artists—VFX designers, sound engineers, colourists—who are often booked across several projects at the same time. This is precisely where a Gantt chart shines, helping to prevent costly scheduling conflicts and making sure everyone is used effectively.
A project manager can use the chart to:
- Schedule Resources: Visually assign artists to specific tasks, making sure no one is double-booked and that the right talent is available exactly when needed.
- Prevent Downtime: By mapping out dependencies, the manager sees precisely when the sound design team needs the final visual cut, preventing them from sitting around with nothing to do.
- Balance Workloads: The chart gives a bird's-eye view of each artist's commitments, helping to distribute work evenly and avoid burning out key team members.
This kind of detailed planning is absolutely fundamental. For a deeper look into this process, our guide on the scheduling of production offers some brilliant insights for optimising your team's time.
Identifying Bottlenecks Before They Happen
One of the most powerful things a Gantt chart does for a creative studio is predict the future—or at least, the most likely version of it. It’s like an early warning system for problems waiting just around the corner.
Let's walk through a common scenario. A project manager is overseeing the post-production of a TV commercial. The Gantt chart shows the visual effects (VFX) task is down for ten days, with the colour grading task ready to kick off immediately after.
A Gantt chart turns reactive problem-solving into proactive strategy. It gives you the foresight to see the ripple effect of a single delay, empowering you to make adjustments before a small issue becomes a full-blown crisis.
On day five, the VFX team hits a technical snag that’s going to cause a three-day delay. Without a Gantt chart, this news might get lost in emails and only become a crisis when the colourist shows up with nothing to work on.
With the chart, however, the project manager sees the impact instantly. The VFX taskbar gets longer, and because the colour grading task depends on it, its start date automatically shunts forward by three days. This visual domino effect immediately flags the new risk: the final delivery deadline is now in jeopardy.
This clarity allows the manager to take immediate, corrective action. They can reshuffle resources, authorise overtime for the VFX team, or simply communicate the revised timeline to the client. Instead of fighting fires, they're managing a predictable risk. This is exactly what a Gantt chart is used for: turning potential chaos into controlled, predictable progress.
Key Benefits of Using Gantt Charts for Project Clarity
For any busy studio manager, time is the one resource you can never get back. The thought of adding yet another tool to your workflow can feel exhausting, but the right one solves far more problems than it creates. Gantt charts are designed to cut through the exact kind of chaos that costs studios money: poor communication and fuzzy planning.
Think about the endless email threads and status meetings you sit through just to get a handle on where a project actually stands. A Gantt chart silences that noise by creating a single, visual source of truth. When the entire team, stakeholders, and even clients are looking at the same timeline, confusion just melts away. Everyone knows what’s happening, what’s coming up next, and how their piece of the puzzle affects the whole picture.
This shared clarity isn't just about convenience—it's a financial imperative. A staggering 57% of project failures are chalked up to breakdowns in communication, with another 39% stemming from poor planning. The harsh reality? Only a tiny 2.5% of companies consistently deliver all their projects on time and on budget. You can find more insights into project success rates on ons.gov.uk.
Creating a Single Source of Truth
A Gantt chart becomes the undisputed reference point for a project. It pulls together all the vital information that’s usually scattered across spreadsheets, email chains, and disconnected conversations, giving you instant answers.
- What’s the current project status? A quick look at the chart tells you which tasks are done, in progress, or haven't been started.
- Are we running on time? The chart puts planned progress right next to actual progress, making any delays impossible to miss.
- Who is doing what? Assignments are clearly marked, which gets rid of any ambiguity and makes it clear who owns each task.
While Gantt charts offer this visual clarity out of the box, sharpening your general communication skills can make your project updates even more effective. Learning what makes a good presentation can help ensure your message always lands perfectly with your audience.
Preventing Burnout and Improving Resource Management
One of the most powerful, yet often overlooked, benefits of a Gantt chart is the ability to see your team's workload in a visual way. It doesn’t just track tasks; it shows who is assigned to them and how those commitments stack up over time. This kind of transparency is a game-changer for managing resources sustainably.
By seeing the entire team's schedule laid out visually, managers can spot when an artist is overcommitted long before they become overwhelmed. This proactive approach to workload balancing is key to preventing burnout and maintaining team morale.
This visual overview helps managers make much smarter decisions on the fly. If one VFX artist is swamped, it’s easy to see who has the bandwidth to jump in and help. This foresight is at the heart of effective resource allocation. To really get into the weeds on this, check out our guide on what is capacity planning and see how it can safeguard your team's well-being.
By tackling the core issues of miscommunication and messy planning head-on, a Gantt chart becomes an essential tool for delivering creative projects successfully.
Right, let's be honest. Gantt charts aren't a silver bullet for every project headache. While they are incredibly powerful, like any tool, they come with their own set of potential problems, especially if you don't manage them properly.
Historically, one of the biggest knocks against Gantt charts was their tendency to become monstrously complex. This is especially true on large-scale projects where they can quickly get out of hand.
Think about the post-production schedule for a feature film. You've got hundreds, maybe thousands, of interconnected tasks. What starts as a clear visual roadmap can morph into a cluttered, intimidating wall of bars. It becomes impossible to read and even harder to manage. At that point, the chart is more of a burden than a benefit, and teams often just give up on it.
Another major hurdle is simply keeping the chart up to date. A project plan is only as good as the information it holds. If it doesn't reflect what's actually happening on the ground, it's not just useless—it's dangerous. An outdated Gantt chart can lead teams to make decisions based on old info, causing a domino effect of delays and confusion.
From Static Plans to Dynamic Hubs
The real trick to solving these issues is to stop thinking of a Gantt chart as a static document and start treating it as a dynamic, living hub for your project. Modern Gantt chart software is built specifically to tackle these exact problems, turning what used to be a rigid blueprint into something collaborative and alive.
Taming Complexity: Instead of getting bogged down listing every tiny sub-task, use summary tasks. You can group all related activities—like all the sound editing jobs—under a single, high-level bar. This keeps the main view clean and lets you dive into the nitty-gritty details only when you need to.
Automating the Updates: This is a game-changer. Modern tools can automate schedule adjustments. When one task gets delayed, any dependent tasks are automatically pushed back. This means your timeline always reflects the current state of play, without someone having to manually tweak everything.
You can see this evolution in other industries, too. For years, the UK’s engineering and construction sectors have relied on Gantt charts to deliver huge projects. Early on, they were static documents for planners, but they’ve since become interactive digital tools. This allows for real-time progress tracking—which is absolutely vital, since projects are never just "done" or "not done." If you're curious, you can read more about the evolution of Gantt charts in UK construction on constructionmanagement.co.uk.
The whole point of a Gantt chart isn't to create a perfect, unchanging plan. It’s to give you a flexible framework that can bend and adapt to the inevitable twists and turns of a real-world project. It's about having the foresight to manage change, not avoid it.
By embracing these modern approaches, you can sidestep the classic drawbacks. Today, the answer to "what is a Gantt chart used for?" isn't just about planning. It's about actively navigating the realities of a project with a tool that is both powerful and incredibly adaptable.
Choosing the Right Gantt Chart Software
Picking the right software is a big deal. The aim isn't just to find a tool that makes pretty timelines; it's to find one that turns a static chart into your project’s dynamic command centre. For creative studios, that means looking past the basics and zeroing in on features that solve real-world production headaches.
A modern Gantt chart needs to be a living, breathing document. It can't be an artefact that’s out of date the second a deadline shifts. You should be looking for tools that offer intelligent, automated scheduling that can actually factor in artist availability and skill sets. That’s how you prevent resource clashes and costly downtime before they even have a chance to happen.
Key Features for Creative Teams
To make sure your new software becomes a genuine asset and not just another subscription, it’s worth prioritising a few key functions that really boost agility and clear communication.
- Real-Time Updates: The software has to adjust timelines automatically. When one task gets delayed, you need to see the ripple effect on every dependent task instantly, without manually tweaking a thing.
- Integrated Collaboration: Hunt for features that let your team comment, share files, and chat right inside a task. This keeps all project-related talk in one place instead of scattered across emails and Slack channels.
- Resource Management: A crystal-clear view of your team's workload is non-negotiable. The software should make it obvious who is working on what, making it simple to reassign tasks and stop burnout in its tracks.
The right software turns your Gantt chart from a simple scheduling tool into the central nervous system of your project. It should adapt to reality, not force reality to fit a rigid plan.
When you bring in an interactive platform, you close the gap between the planners and the people doing the actual work. This allows for lightning-fast adaptation to things like client feedback or unexpected technical hiccups. For creative studios, this is what keeps complex, multi-stage projects on track and everyone accountable. You can explore more on how digital charts reduce costly schedule overruns on procore.com.
Your Gantt Chart Questions, Answered
Even after getting the hang of what Gantt charts do, a few practical questions always pop up when studios think about bringing them into the fold. Let's tackle some of the most common ones.
Aren't Gantt Charts Too Complicated for Small Projects?
It’s a fair question, but the short answer is no. A Gantt chart’s complexity is completely up to you. For a small project, say a quick promotional video, your chart might only have a dozen or so tasks. The goal isn't to create a monster spreadsheet; it's to give everyone a clear visual of what needs to happen and when.
Modern tools are built to scale. You can create a simple, clean chart without getting tangled up in features you don’t need. The tool should always serve the project, not the other way around.
How Long Does It Take for a Team to Get Up to Speed?
The learning curve for Gantt charts has flattened out massively. Older tools felt like you needed a pilot's licence to operate them, but today's platforms are designed for actual humans. Most teams can pick up the essentials—making tasks, setting dates, and linking them together—in an afternoon.
The trick is to start with the basics. Don't try to master everything at once. Once your team is comfortable with the core functions, you can start exploring the more advanced stuff like resource balancing or finding the critical path.
The point isn’t to become a Gantt chart guru overnight. It’s about giving your team a visual tool that immediately clears up confusion and shows them exactly what they need to do.
Can Gantt Charts Work With Our Other Tools?
Absolutely. In fact, they have to. This is one of the biggest leaps forward for modern Gantt software. Good tools don't lock your data away in a silo; they connect with the software your studio already relies on every day.
Think of connections like:
- Communication Apps: For pinging team members with automatic updates so you don’t have to.
- Calendars: To sync project deadlines right into your team’s daily schedules.
- File Storage: To link scripts, dailies, and other assets directly to the tasks where they're needed.
When everything is connected, your Gantt chart becomes the single source of truth—a central hub that pulls all the scattered pieces together to give you a clear picture of how the project is really doing.
Ready to bring this kind of clarity and control to your studio's workflow? freispace offers intuitive, Gantt-style planning with powerful automation built specifically for the chaos of post-production. See how it works at freispace.com.