To get the most out of Earned Value, you need to understand the three core numbers that drive it: Planned Value (PV), which is your project's budget; Actual Cost (AC), which is what you've spent so far; and Earned Value (EV), the budgeted cost of the work you’ve actually finished.
It's a powerful way to measure how your project is performing against the original plan.
Why Earned Value Matters
Before we get bogged down in the formulas, let’s get one thing straight. Earned Value Management (EVM) isn't just a stuffy accounting task; it’s more like a health check for your project.
Traditional budget tracking just looks at planned spend versus actual spend. This can be seriously misleading. Sure, you might be under budget, which feels great on the surface. But what if you’re also miles behind schedule? That's a false win, and it hides a much bigger problem.
EVM cuts through that fog by pulling scope, schedule, and cost into one unified view. It forces you to answer the most important question of all: "What have we actually got for the money we've spent?" Answering that is what makes this whole thing so incredibly useful.
The Three Pillars of EVM
At the heart of every earned value calculation are three key metrics. Get your head around these, and the rest of the formulas will just click into place.
Planned Value (PV): This is the approved budget for the work you planned to have done by a specific date. Think of it as your baseline—the yardstick you measure everything against.
Actual Cost (AC): This one’s simple. It’s the total amount of money you’ve actually spent to get the work done up to this point. It’s what has left the bank account.
Earned Value (EV): This is the value of the work you’ve actually completed, measured in terms of its original budgeted cost. It’s the true, objective measure of your progress.
These three numbers work together to give you a proper, multi-dimensional look at your project's health. To really get this right, many pros rely on effective project management software that can track and analyse all this data without the headache.
And the benefits are real. A 2020 survey of 500 UK firms revealed that 68% of those using EVM saw a 22% improvement in on-time delivery. In a country with massive public procurement spending, that's a game-changer.
To truly master this, you need a solid foundation. Getting these concepts right is the first step in levelling up your entire project planning process.
Core Earned Value Metrics at a Glance
Getting to grips with EVM means internalising what PV, AC, and EV really represent. This table breaks down the three pillars of any earned value calculation.
| Metric | What It Measures | Key Question It Answers |
|---|---|---|
| Planned Value (PV) | The budgeted cost of work scheduled to be completed. | "How much work should be done by now?" |
| Actual Cost (AC) | The real cost incurred for the work that has been done. | "How much have we actually spent so far?" |
| Earned Value (EV) | The budgeted cost of the work that is actually complete. | "What is the value of the work we've finished?" |
Understanding the distinct role each metric plays is crucial. They are the building blocks for all the variance and performance indicators that give you a complete picture of project health.
Getting to Grips with Your Core Metrics: PV, EV, and AC
Alright, with the theory out of the way, let's get our hands dirty. The real magic of earned value analysis happens when you start plugging your own project data into its core formulas. This isn’t about abstract concepts; these calculations are surprisingly straightforward once you know what each piece of the puzzle represents.
To make this real, we'll walk through a scenario I’m sure many in a creative agency will recognise: a video post-production project. Let's say the total approved budget is £10,000—this is our Budget at Completion (BAC). The whole thing is scheduled to run for 10 weeks, and for our analysis, we're checking in at the end of Week 5.
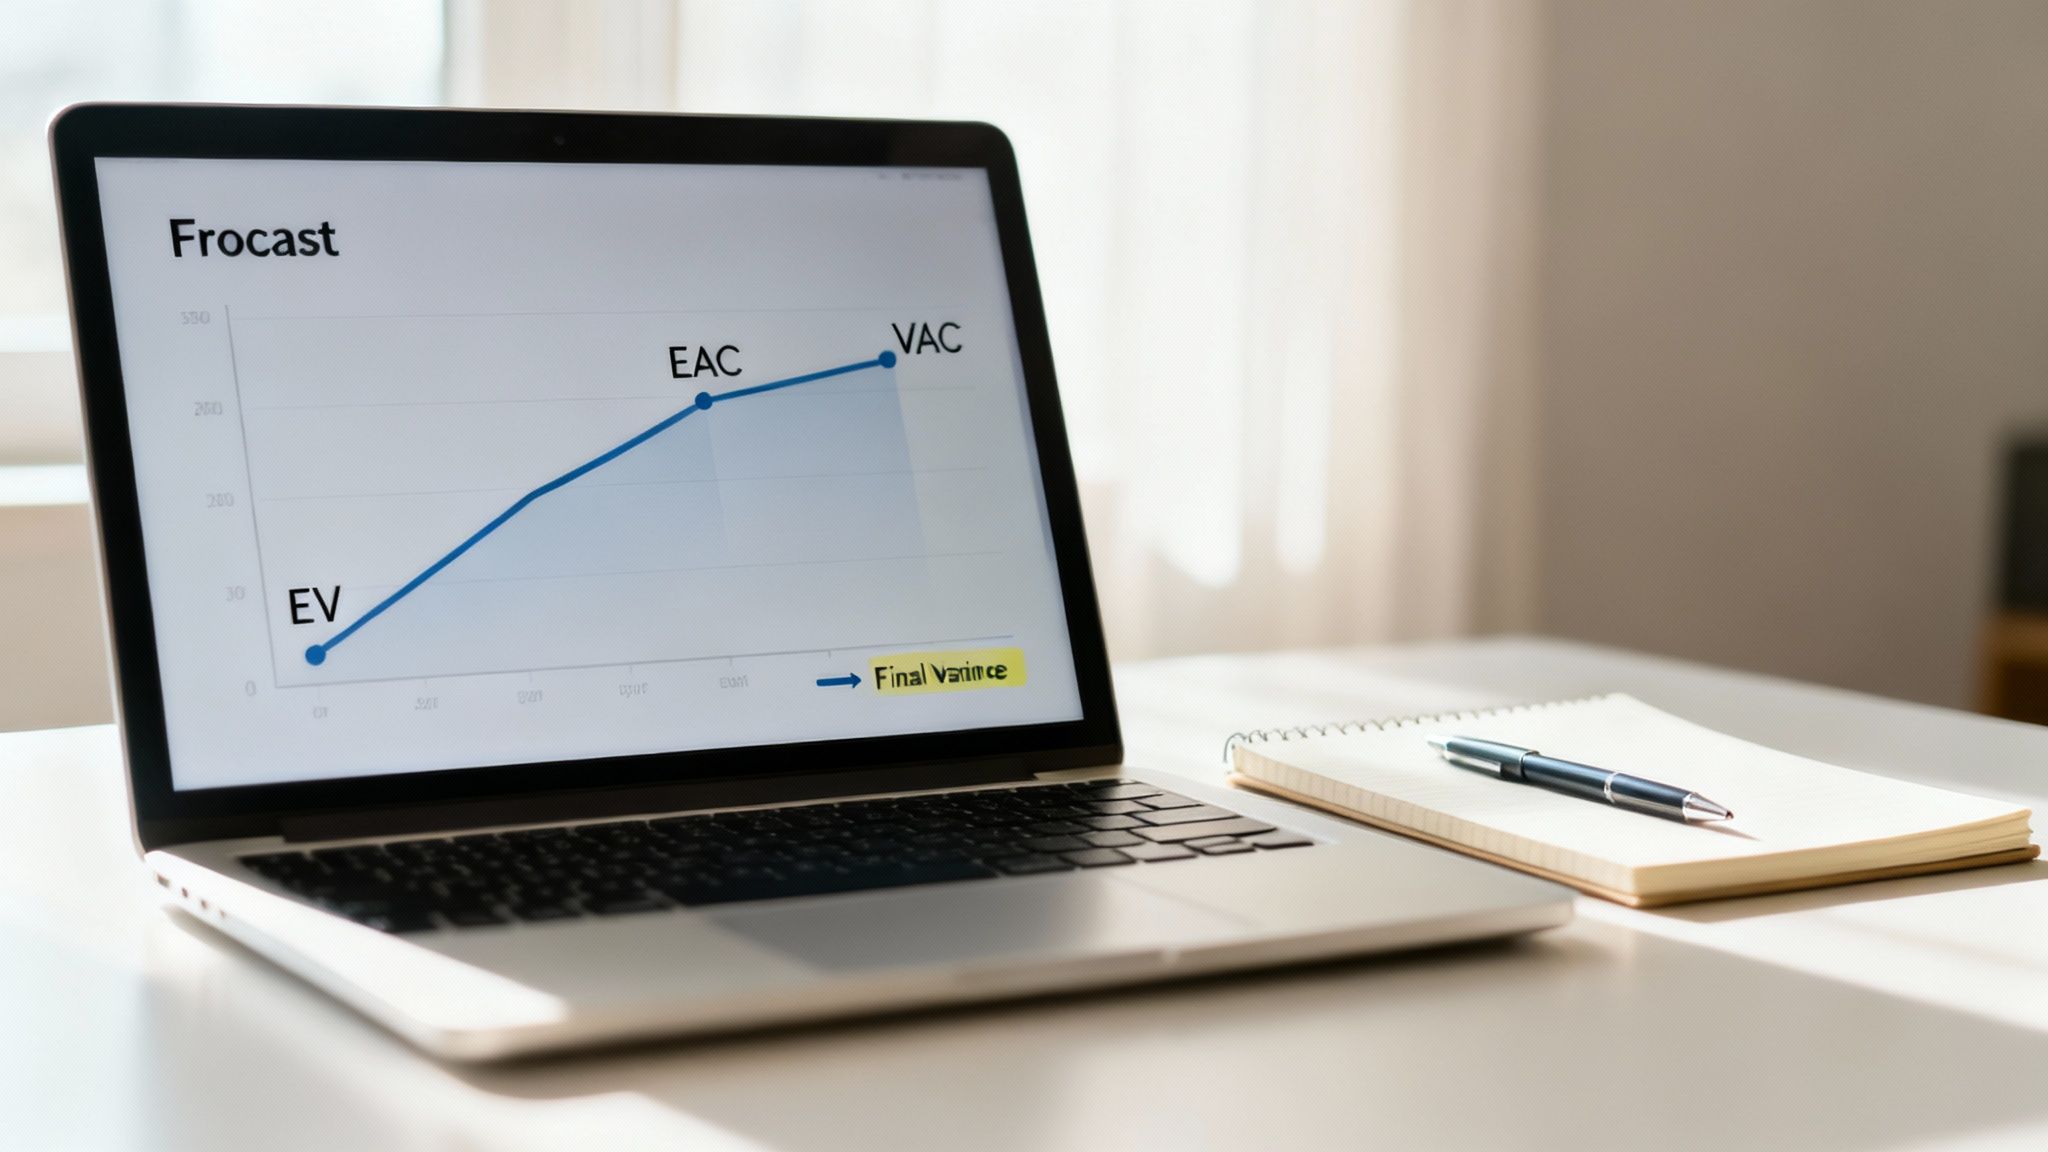
This simple flow chart gives a great visual overview of the three key metrics we’re about to calculate.
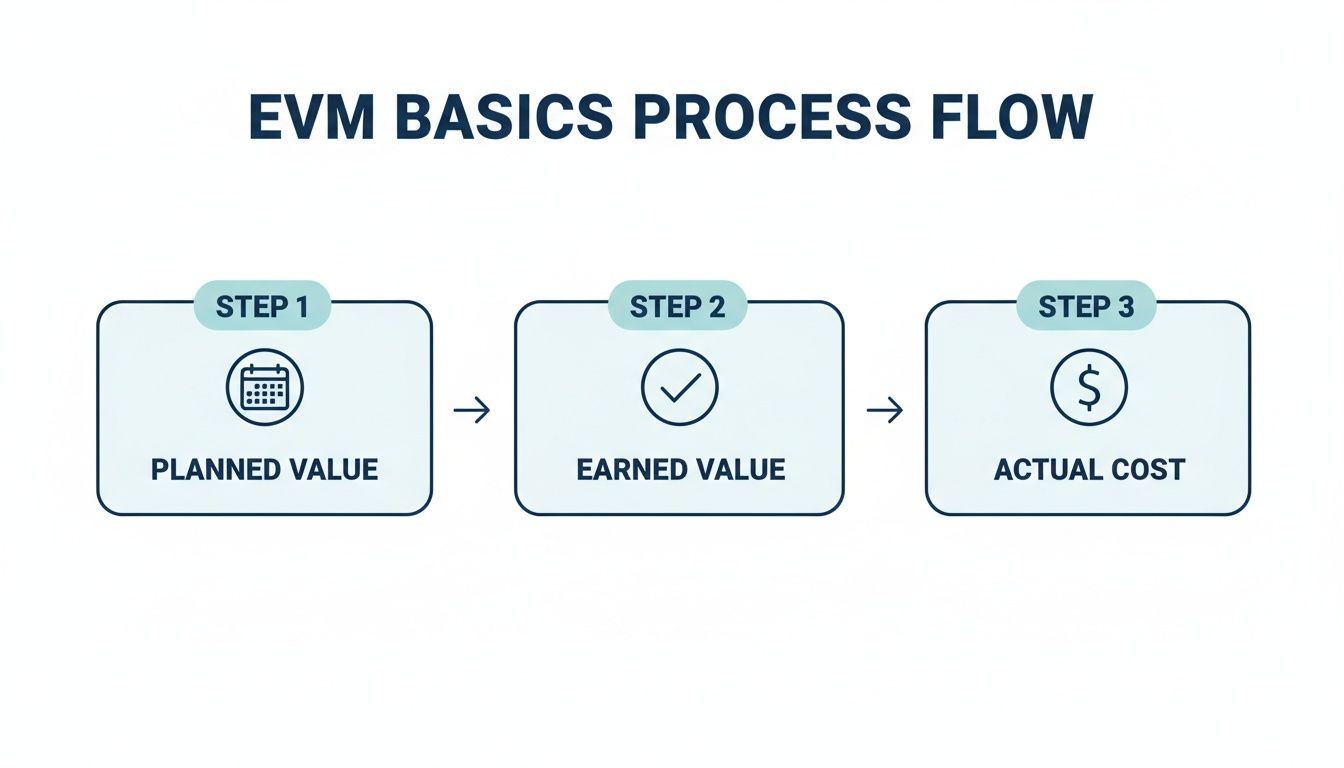
It shows how you move from what you planned to do (Planned Value), to what you've actually finished (Earned Value), and finally, to what you've really spent (Actual Cost).
Finding Your Planned Value
First up is Planned Value (PV). Think of this as your baseline—the authorised budget for all the work you scheduled to have done by a specific date. It answers a simple but vital question: "How much work should we have completed by now?"
The formula is pretty clean:
PV = BAC x % of Work Planned
In our video project, we're at the end of Week 5 of a 10-week schedule. Simple maths tells us we should be halfway through, meaning 50% of the work ought to be done.
- BAC = £10,000
- % of Work Planned = 50%
So, the calculation is just: PV = £10,000 x 0.50 = £5,000. Based on the original plan, you should have completed £5,000 worth of work by now.
Determining Your Earned Value
Next is Earned Value (EV). This is where things get interesting. EV measures the value of the work you have actually completed. It's the most honest progress report you can get, answering: "What's the value of what we've truly accomplished?"
The formula looks similar, but the input is critically different:
EV = BAC x % of Work Actually Completed
Let's imagine you've had a check-in with the post-production team. It turns out that colour grading took a bit longer than expected, and you determine that only 40% of the total project is actually finished.
- BAC = £10,000
- % of Work Actually Completed = 40%
The EV calculation is then: EV = £10,000 x 0.40 = £4,000. This figure is powerful. It tells you that, no matter how much time has passed or money has been spent, the objective value of the work delivered so far is £4,000.
Tracking Your Actual Cost
Finally, there’s Actual Cost (AC). This one is the most straightforward of the three. It’s the total amount of money you’ve spent to get the work done to date. It answers the most direct question of all: "How much have we actually spent?"
There’s no fancy formula here; it all comes down to meticulous tracking. You'll need to add up every single project-related expense up to your check-in date. This typically includes:
- Labour Costs: Hours logged by editors, VFX artists, and sound designers.
- Material Costs: Any fees for stock footage, music licensing, or software plugins.
- Overheads: All other direct project expenses that have been incurred.
For our video project, let's say you've gone through the timesheets and invoices and find the total spend at the end of Week 5 is £4,500. That makes your AC = £4,500.
With these three numbers—PV, EV, and AC—you have the raw data needed to properly assess your project's health. You can't rely on guesswork for effective budgeting and controlling; this is how you move from hoping you're on track to knowing it. These metrics are the foundation for all the deeper analysis we'll get into next, like performance indices and forecasting.
Gauging Project Health with CPI and SPI
Once you have your Planned Value (PV), Earned Value (EV), and Actual Cost (AC), you’ve got the raw ingredients. But the real magic happens when you mix them together to calculate performance indices. These simple ratios cut through the noise and tell you instantly if you’re on track, burning through cash, or falling behind schedule.
Think of them as your project's early warning system.
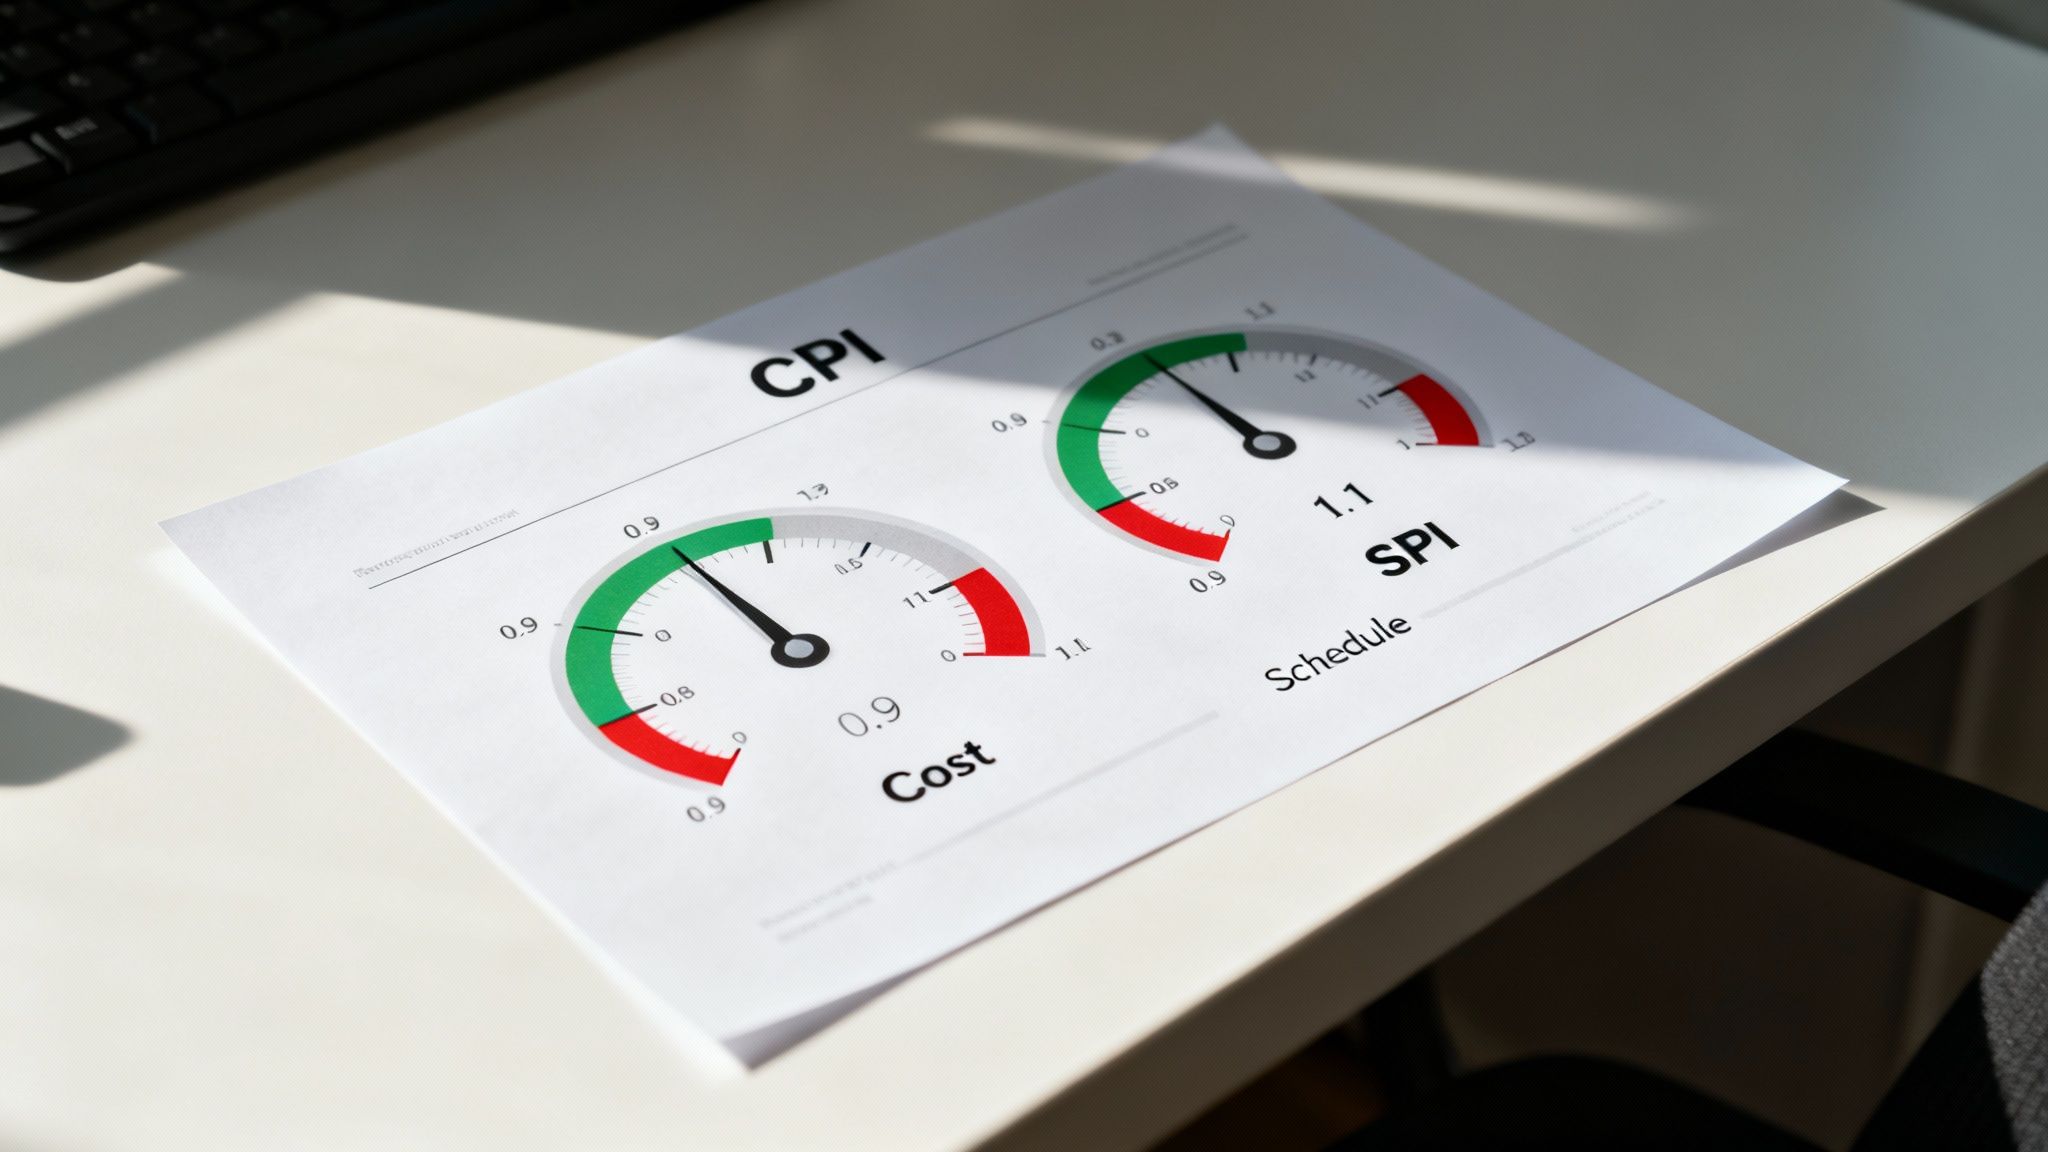
Let's put our video project data to work and calculate the two most critical indices: the Cost Performance Index (CPI) and the Schedule Performance Index (SPI). These are the metrics that make the whole calculation of earned value genuinely useful in the real world.
Understanding Your Cost Performance Index
The Cost Performance Index (CPI) is all about your project's cost efficiency. It answers one crucial question: "For every pound we’ve spent, how much value have we actually earned?" A CPI dipping below 1.0 is a serious red flag that you're heading for a budget overrun.
The formula is beautifully straightforward:
CPI = EV / AC
Using the figures from our video post-production example:
- EV = £4,000
- AC = £4,500
Plugging those in gives us: CPI = £4,000 / £4,500 = 0.89.
What does that 0.89 really mean? It tells us that for every single pound we've spent, we’ve only generated 89 pence of value. We are officially over budget for the work we've managed to complete so far.
Measuring Your Schedule Performance Index
Next up is the Schedule Performance Index (SPI), which zeroes in on your project's time efficiency. It tells you whether you're ahead of or behind your original plan by answering: "Are we progressing at the rate we planned?" Just like with CPI, a number less than 1.0 means you're lagging.
The formula is just as simple:
SPI = EV / PV
Let’s go back to our video project data one more time:
- EV = £4,000
- PV = £5,000
Our SPI calculation is: SPI = £4,000 / £5,000 = 0.80.
An SPI of 0.80 is a clear signal that we’re progressing at only 80% of the originally planned rate. In simple terms, we're well and truly behind schedule.
On massive projects, these indices are absolutely vital. Take the HS2 high-speed rail project, which kicked off with a £32.7 billion budget. By 2023, its EVM dashboards were showing a CPI of 0.84 and an SPI of 0.93. These weren't just numbers on a screen; they were clear, quantifiable signals of cost and schedule pressures that forced vital corrective actions. You can discover more about the project's financial adjustments and see how these figures influenced major economic forecasts.
Interpreting Performance Index Values
So, what do you do with these numbers? The goal is to translate them into action. A value of 1.0 is your North Star—it means you're performing exactly as planned. Anything above 1.0 is great news, while anything below is a call to investigate.
Here’s a quick-glance table to help you interpret what your CPI and SPI values are telling you about your project's health.
Interpreting Performance Index Values
| Index Value | Cost Performance (CPI) Meaning | Schedule Performance (SPI) Meaning |
|---|---|---|
| > 1.0 | You are under budget. For every £1 spent, you are earning more than £1 in value. | You are ahead of schedule. You are completing work faster than planned. |
| = 1.0 | You are exactly on budget. Performance is matching the plan perfectly. | You are exactly on schedule. Progress is precisely as planned. |
| < 1.0 | You are over budget. You are spending more than the value of the work completed. | You are behind schedule. Progress is slower than originally planned. |
Looking at our video project, the CPI of 0.89 and SPI of 0.80 paint a very clear, if slightly worrying, picture. We are both over budget and behind schedule—a classic double whammy for any project manager.
The beauty of this is that we can now move beyond vague feelings of being "a bit behind" and have concrete data to figure out our next steps.
Forecasting Final Costs with EAC and VAC
It’s one thing to know you’re over budget and behind schedule. It’s another thing entirely to know exactly how much you’re going to miss the mark by. This is where your earned value calculation really comes alive, shifting from a backward-looking analysis to a powerful forecasting tool. Using the data you’ve already pulled together, you can start predicting your project's final financial outcome with a surprising degree of accuracy.
We do this with two key metrics: the Estimate at Completion (EAC) and the Variance at Completion (VAC). Think of them as your crystal ball. They work together to give you a clear, data-driven glimpse into the future, helping you make smart adjustments now to avoid bigger financial headaches later on.
Choosing the Right EAC Formula
The Estimate at Completion (EAC) is essentially your new best guess for the project's total cost, based on how things have been going so far. There isn't just one way to figure it out, though. The right formula depends on your honest assessment of why you’re seeing a variance in the first place.
When you expect current performance to continue: If that CPI of 0.89 reflects a new reality—maybe the work is just trickier than anyone anticipated—it's wise to assume this trend will hold. This is the most common scenario I see, and often the most realistic. The formula is EAC = BAC / CPI.
When the problem was a one-off hit: Maybe an unexpected software licence fee threw your early budget off, but you’re confident you’ll be right on track from this point forward. In that case, you just add the remaining planned work to what you've already spent. The formula here is EAC = AC + (BAC - EV).
For our video project, the cost overruns feel more systemic than like a one-time blip, so we’ll stick with the first formula. With a Budget at Completion (BAC) of £10,000 and a Cost Performance Index (CPI) of 0.89, the calculation is pretty straightforward:
EAC = £10,000 / 0.89 = £11,236
So, our project, which we originally budgeted at £10,000, is now forecast to cost a total of £11,236. This is the real power of EVM in action. It’s not just a hunch; it’s a data-backed prediction. In fact, a 2022 PwC UK study found that for projects using EVM, this exact EAC formula was 85% accurate in forecasting final costs. That's a level of foresight that lets you get ahead of problems.
Calculating Your Variance at Completion
Once you have your EAC, figuring out the Variance at Completion (VAC) is simple. It shows you the difference between what you thought you’d spend and what you’re now expecting to spend. Are you heading for a surplus, or a deficit?
The formula is just a simple subtraction:
VAC = BAC - EAC
Let’s plug in the numbers from our project:
- BAC = £10,000
- EAC = £11,236
VAC = £10,000 - £11,236 = -£1,236
The result? We’re projecting a budget deficit of £1,236. This single number is incredibly powerful. It's the figure you can take straight to stakeholders to explain the real-world financial impact of your team's current performance. This allows you to have proactive, informed conversations about adjusting scope, reallocating resources, or securing more budget. Getting a handle on this is a cornerstone of solid project finance management.
While EAC and VAC give us sharp, project-specific forecasts, it's also worth understanding broader financial forecasting techniques that can be applied across all of your business operations.
Where Earned Value Calculations Can Go Wrong
Putting Earned Value Management into practice is where the theory gets a reality check against the beautiful mess of a live project. It's easy to stumble, and a few common tripwires can quickly undermine your whole analysis, turning a powerful tool into just another source of confusion. Sidestepping these pitfalls is the key to making EVM actually work for you.
One of the most frequent mistakes I see is relying on subjective progress updates. When a team member says a complex task is "about 80% done," that number is often based more on optimism than objective fact. This creates a misleading Earned Value (EV) figure right out of the gate, which then throws off all your performance indices and forecasts.
Another classic problem is an unstable project baseline. Your Planned Value (PV) is your yardstick; if it's constantly shifting without a formal change control process, you’re trying to measure progress against a moving target. Meaningful variance analysis becomes pretty much impossible.
Nail Down Your Progress Measurement
To fight back against vague progress reporting, you need to get concrete. Don't just ask for a percentage; define how that percentage is earned. This simple shift brings a much-needed discipline and objectivity to your earned value calculation.
Here are a couple of straightforward methods you can use:
- The 0/100 Method: Brilliantly simple. A task is worth 0% until it is 100% complete. This is perfect for small, short-duration tasks where "in-progress" doesn't tell you much anyway.
- The Milestone Method: For bigger chunks of work, you can assign a specific budget value to hitting key milestones. For instance, completing the 'Rough Cut' of a video might earn 40% of the editing budget, while hitting the 'Final Sound Mix' milestone unlocks the next 30%.
By setting clear, objective rules for how progress is measured, you take the guesswork out of the equation. This makes sure your Earned Value figure is a reliable indicator of what's truly been accomplished, not just what feels complete.
Keep Your Cost and Schedule Tracking in Sync
The final common mistake is a simple mismatch of data. Your Actual Cost (AC) has to be tracked with the same discipline and on the same timeline as your Earned Value. If your cost data lags by a week, you'll be comparing this week's progress against last week's spending. Your CPI figures will be completely skewed.
Likewise, your schedule has to be fully integrated. The work packages in your project plan should map directly to the tasks you're tracking for cost and progress. Without this alignment, you can't be sure you are measuring the right things, which can invalidate your entire analysis. A disciplined, consistent approach to tracking all three core metrics—PV, EV, and AC—is the bedrock of trustworthy project control.
Got Questions About Earned Value?
When you first dip your toes into Earned Value Management, a few questions always seem to pop up. It’s completely normal. Getting your head around these concepts is the key to using them confidently and making sure your whole team is on the same page.
Let’s tackle some of the most common ones we hear.
What's the Real Difference Between Earned Value and Planned Value?
It’s actually simpler than it sounds. Think of Planned Value (PV) as your project’s blueprint. It’s the budget for the work you planned to have done by a specific date. It’s your original game plan.
Earned Value (EV), on the other hand, is what’s actually happening on the ground. It’s the value of the work you’ve truly completed. So, while PV is where you hoped to be, EV tells you the value of where you are. Getting this distinction right is the heart and soul of EVM.
Can I Really Use Earned Value on Agile Projects?
Absolutely, though it does need a slight change in perspective. Forget planning the entire project in one massive go. Instead, you can apply EVM principles to individual sprints or releases.
Your 'plan' (PV) becomes the total story points you've committed to for a sprint. Your 'earned value' (EV) is simply the value of the story points you tick off as done. The trick is to shift the EVM mindset from a rigid, long-term plan to something that fits a more fluid, iterative workflow.
How Do I Start Using EVM on a Small Project?
The key is not to over-engineer it. You don’t need complex software to get started; a simple spreadsheet will do the trick just fine.
The secret to starting with EVM isn't about having fancy tools; it's about disciplined, consistent tracking. Even basic data, gathered regularly, will provide more insight than no data at all.
Just focus on these three things to get going:
- Define the Work: Break your project into clear, manageable tasks and give each one a budget. This adds up to your Budget at Completion (BAC).
- Create a Timeline: Lay out when each task should happen. This gives you the map for your Planned Value (PV) over time.
- Track Consistently: This is the most important part. Every week, diligently track two numbers: what you’ve actually spent (AC) and a realistic percentage of work completed for each task.
That’s it. With that data, you have everything you need to calculate your EV, CPI, and SPI. When you're just starting out, consistency beats complexity every single time.
Ready to take control of your post-production workflows with data you can actually use? freispace brings your time tracking and budgeting together to make earned value analysis feel effortless. Get the clarity you need to keep every project on time and on budget.
Discover a smarter way to manage your studio at https://freispace.com.