
To really get a handle on your project's health, you need to look at three core numbers: the budgeted cost of work scheduled (that's your Planned Value), the budgeted cost of work you've actually done (Earned Value), and what it really cost to get that work done (Actual Cost).
It's a simple but powerful way of comparing the value of the work you've completed against both your original plan and the actual cash you've burned through. This isn't just about tracking spend; it's an objective health check on your project's real progress.
Mastering Project Performance by Understanding Earned Value

If you want to manage modern projects effectively, you have to move beyond just tracking the budget. Instead of only asking, "How much have we spent?", Earned Value Management (EVM) pushes you to ask a much smarter question: "What have we actually achieved for the money we've spent?"
That single shift in perspective is the key to unlocking genuine insights into your project's performance.
Think of it like building a garden shed. Your initial plan is the bedrock of your EVM system. It lays out what you're building (scope), when you'll build it (schedule), and how much you think it will cost (budget). Earned value analysis simply takes that blueprint and compares it to the messy reality on the ground at any given moment.
The Three Pillars of Earned Value
At its core, EVM is built on three straightforward components. You absolutely have to get your head around these before you can calculate anything. Think of them as the three coordinates that pinpoint your project's exact location on its journey from start to finish.
To make this crystal clear, here’s a quick-reference table defining these fundamental pillars.
Earned Value Management Core Concepts at a Glance
| Metric | What It Represents | Simple Question It Answers |
|---|---|---|
| Planned Value (PV) | The authorised budget for the work you planned to do. | "How much work should be done by now?" |
| Earned Value (EV) | The value of the work you've actually completed. | "What's the budget for the work we've finished?" |
| Actual Cost (AC) | The total money you've really spent to do the work. | "How much cash has actually gone out the door?" |
Comparing these three figures gives you that objective, data-driven view. Are you ahead of schedule but burning through cash? Or maybe you’re behind but spending less than planned? EVM gives you the straight answers, no guesswork involved.
By integrating scope, schedule, and cost into one unified system, EVM gives you a clear, consistent, and objective way to measure how you're doing and, crucially, predict where you're heading. It gets rid of the vague "I think we're about 80% done" feelings that often hide serious problems under the surface.
Taking this rigorous approach is especially vital in complex industries. For instance, around 37% of UK-based IT and engineering projects hit major snags because of poor tracking and cost control. More often than not, this comes from not calculating and monitoring Earned Value, which is the only thing that provides that crucial, unified view of progress. If you want to dive deeper, there are some great insights on the benefits of earned value at agilemania.com.
In the next sections, we'll walk through exactly how to calculate these metrics, make sense of the results, and use them to keep your projects on track and within budget.
Getting to Grips with Your Project's Core Numbers
To get a real handle on earned value, you need to nail down three core metrics first. These aren't just abstract figures; they are the bedrock of your entire performance analysis. Get them right from the start, and you'll have data you can actually trust.
Let's walk through it with a real-world example. Imagine you're running the post-production for a short film. The total budget is £100,000, and the schedule is set for 10 weeks. We'll use this scenario to bring the numbers to life.
Pinning Down Your Planned Value (PV)
Planned Value, or PV, is simply the approved budget for the work you’ve scheduled to complete by a certain date. Think of it as your roadmap. Without a stable PV, trying to measure performance is just guesswork.
To figure out your PV, you just look at your project plan and add up the value of the tasks that are supposed to be finished by your status update.
Planned Value Formula: PV = (Planned % of Work Complete) x (Budget at Completion)
Okay, back to our film project. We're at the end of Week 4 of the 10-week schedule. According to the plan, we should have 40% of the work done by now.
- PV Calculation: 40% of £100,000 = £40,000
This tells us that, by the end of Week 4, our schedule said we should have completed £40,000 worth of work. It’s a straightforward calculation, but its reliability hinges on a solid project scope and schedule. The quality of your initial planning really matters here, and many project managers are now leveraging improved Microsoft 365 project planning tools to build the kind of robust schedules that make this possible.
Measuring Your True Earned Value (EV)
Next up is Earned Value (EV). This metric represents the value of the work you've actually completed. It’s often the hardest one to pin down because it demands an honest look at your progress. Just because four weeks have passed doesn't mean you've done 40% of the work.
The key here is to avoid subjective feelings like, "Yeah, it feels about 35% done." You need concrete, objective ways to measure what's finished.
Earned Value Formula: EV = (Actual % of Work Complete) x (Budget at Completion)
Let's check in on our film again. At the end of Week 4, we take stock and realise the sound mix is dragging on. After a proper assessment, we see that only 35% of the total project work is actually complete.
- EV Calculation: 35% of £100,000 = £35,000
So, while the plan said we should have £40,000 worth of work done (our PV), we’ve only earned £35,000 in value. Right away, that’s a red flag for our schedule.
Tracking Your Actual Cost (AC)
Finally, we have Actual Cost (AC), sometimes called the Actual Cost of Work Performed (ACWP). This one is the most direct of the three: it’s the total cash you’ve actually spent to get the work done so far.
Calculating AC requires a bulletproof system for tracking every single project cost—staff hours, software licences, freelancer invoices, equipment hire, you name it. If you don't track these costs accurately, your whole analysis will be off. A good project management platform makes this much easier by integrating timesheets and expenses, giving you tight financial control. We cover this in more detail in our guide to budgeting and financial controlling in projects.
Let’s say at the end of Week 4, we’ve run into some surprises. We had to bring in a specialist colourist for a couple of days at a premium rate. Tallying up all the timesheets and invoices, we find our total spend is £42,000.
- AC: £42,000
Now we have our three foundational metrics, giving us a clear, unbiased picture of our project's health.
| Metric | Calculation (End of Week 4) | Result | What It Tells Us |
|---|---|---|---|
| Planned Value (PV) | 40% of £100,000 | £40,000 | We planned to have this much work done. |
| Earned Value (EV) | 35% of £100,000 | £35,000 | We actually got this much work done. |
| Actual Cost (AC) | Sum of all expenses | £42,000 | We spent this much to get the work done. |
Just a quick glance at these numbers tells a story. We've done less work than planned (£35,000 EV vs. £40,000 PV) and spent more than the value we've created (£42,000 AC vs. £35,000 EV). This tells us our project is officially behind schedule and over budget—a critical insight that simple budget tracking alone would never reveal.
Translating Data into Performance Insights
Having your Planned Value, Earned Value, and Actual Cost figures is a great first step, but those numbers are just the raw ingredients. The real magic happens when you start combining them to calculate performance variances and indices. This is how you translate basic data into a clear story about your project's health, showing you exactly where you're on track, where you're falling behind, and how efficiently your budget is being spent.
It's the critical process that turns simple data collection into genuinely data-driven decision-making. The flowchart below maps out this journey, from capturing the foundational metrics to generating insights you can actually use.
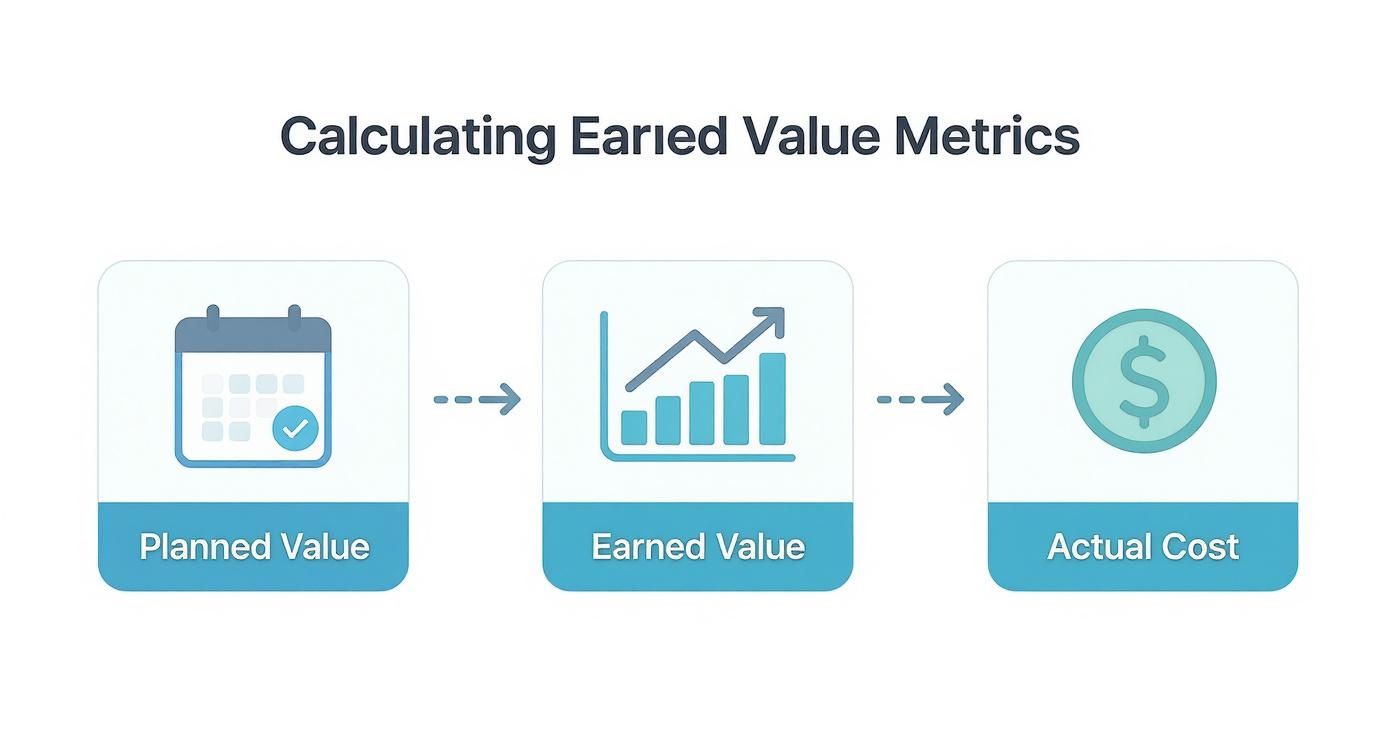
As you can see, Planned Value sets the baseline, Earned Value measures your progress against it, and Actual Cost tracks what you've really spent. Together, they form the bedrock of all further analysis.
Checking Your Schedule with Schedule Variance
The first vital insight you'll want to uncover is your Schedule Variance (SV). This simple calculation tells you if you're ahead of or behind your original plan, measured in monetary terms. It directly compares the value of the work you've actually completed (EV) against the value of the work you should have completed by now (PV).
The formula is pretty straightforward:
Schedule Variance Formula: SV = Earned Value (EV) - Planned Value (PV)
Let’s jump back to our post-production project. At the end of Week 4, we had these figures:
- EV = £35,000
- PV = £40,000
Plugging those numbers into the formula gives us:
- SV Calculation: £35,000 - £40,000 = -£5,000
A negative result is an immediate red flag. It means we are £5,000 behind schedule in terms of value. We’ve delivered less work than we planned to by this point. If the SV were positive, we’d be ahead of schedule, while an SV of zero means we’re perfectly on track.
Analysing Budget Health with Cost Variance
Next up, we need to get a handle on our budget performance. Cost Variance (CV) tells you whether you're under or over budget for the work you've already done. It’s a comparison of the value you've earned (EV) to what it actually cost you to earn it (AC).
This is a much more powerful metric than just comparing the total budget to your total spend, because it’s directly tied to tangible progress.
Cost Variance Formula: CV = Earned Value (EV) - Actual Cost (AC)
Using the numbers from our film project:
- EV = £35,000
- AC = £42,000
The calculation looks like this:
- CV Calculation: £35,000 - £42,000 = -£7,000
Another negative number. This tells us we are £7,000 over budget for the work we've managed to complete so far. Put another way, we spent £42,000 to get just £35,000 worth of value. If the result were positive, we'd be under budget—a great position to be in.
Measuring Efficiency with Performance Indices
While variances give you the raw deviation in pounds, performance indices offer a standardised measure of efficiency. These ratios are incredibly useful for comparing performance over time or even across different projects.
The two you absolutely need to know are the Cost Performance Index (CPI) and the Schedule Performance Index (SPI).
The Cost Performance Index (CPI)
The CPI reveals how efficiently you're using your budget. It’s a simple ratio of the value you've earned to the costs you've incurred.
Cost Performance Index Formula: CPI = Earned Value (EV) / Actual Cost (AC)
For our project:
- CPI Calculation: £35,000 / £42,000 = 0.83
A CPI below 1.0 means you're over budget. Our result of 0.83 shows that for every £1.00 we've spent, we've only earned £0.83 in value. A CPI above 1.0 would signal brilliant cost efficiency.
The Schedule Performance Index (SPI)
In the same way, the SPI measures your schedule efficiency. It’s the ratio of the work you’ve actually performed to the work you had planned to perform.
Schedule Performance Index Formula: SPI = Earned Value (EV) / Planned Value (PV)
For our struggling film:
- SPI Calculation: £35,000 / £40,000 = 0.875
An SPI below 1.0 means your project is lagging behind schedule. Our result of 0.875 shows we are progressing at only 87.5% of the rate we originally planned. An SPI above 1.0, on the other hand, would mean we're working faster than planned.
These metrics aren't just for internal navel-gazing. As organisations like the UK's Office of Rail and Road have pointed out, EVM figures are instrumental for forecasting completion costs and timelines against operational plans. For a deeper dive into its history, you can find more on the development of earned value management and its applications.
Interpreting Your EVM Performance Indicators
Getting the numbers is one thing; knowing what they mean is another. This table gives you a quick-reference guide to what your variances and indices are telling you about project performance.
| Indicator | Formula | Value > 1.0 or Positive | Value < 1.0 or Negative |
|---|---|---|---|
| Schedule Variance (SV) | EV - PV | Ahead of schedule | Behind schedule |
| Cost Variance (CV) | EV - AC | Under budget | Over budget |
| Schedule Perf. Index (SPI) | EV / PV | Progressing faster than planned | Progressing slower than planned |
| Cost Perf. Index (CPI) | EV / AC | Cost-efficient (getting more value than you're paying for) | Inefficient (spending more than the value you're getting) |
Keep this handy. It helps translate the maths into a clear, actionable story about your project’s health. By regularly calculating these variances and indices, you gain a dynamic view of your project, allowing you to take corrective action before minor issues become major headaches.
Using Earned Value to Forecast Project Outcomes

Knowing where your project stands right now is powerful. But predicting where it's headed? That’s where Earned Value Management really proves its worth. Once you’ve calculated your core EV metrics and performance indices, you can shift from just reacting to problems to proactively forecasting them. It turns EVM from a simple reporting tool into an essential early warning system.
This forecasting magic comes down to two key metrics: the Estimate at Completion (EAC) and the Estimate to Complete (ETC). These calculations give you a data-driven look at your project's final cost and how much more money you'll need to get there, taking you far beyond gut feelings or wishful thinking.
This is where the real power of earned value lies, especially when you pair it with solid predictive analytics software to look even further down the road.
Estimating the Remaining Cost to Complete
First up is the Estimate to Complete (ETC). In simple terms, this is the projected cost of finishing all the work that's left. It’s a crucial number for planning your resources and, just as importantly, managing your stakeholders' expectations about future funding.
The most common way to calculate ETC assumes that your cost efficiency to date will probably continue. It's a realistic take, especially if the issues causing your cost overruns are systemic problems, not just one-off mistakes.
ETC Formula: ETC = (Budget at Completion - Earned Value) / Cost Performance Index
Let’s jump back into our post-production project example. We know:
- Budget at Completion (BAC): £100,000
- Earned Value (EV): £35,000
- Cost Performance Index (CPI): 0.83
Plugging those numbers in gives us:
- ETC Calculation: (£100,000 - £35,000) / 0.83 = £65,000 / 0.83 = £78,313
This tells us we're on track to spend another £78,313 to get this project over the finish line, assuming our spending efficiency doesn't change.
Forecasting the Final Project Cost
Once you have your ETC, figuring out the Estimate at Completion (EAC) is a piece of cake. The EAC is your new, forecasted grand total for the project. It’s simply what you've already spent plus what you now expect to spend.
EAC Formula: EAC = Actual Cost (AC) + Estimate to Complete (ETC)
Using our project's figures again:
- Actual Cost (AC): £42,000
- Estimate to Complete (ETC): £78,313
And the final forecast:
- EAC Calculation: £42,000 + £78,313 = £120,313
This forecast is a serious red flag. Our project, which started with a £100,000 budget, is now projected to cost over £120,000. This is the kind of hard data that lets you approach stakeholders with a credible forecast, not just an apology after the budget is blown.
Choosing the Right EAC Formula for Your Situation
The formula we just used is the go-to when you expect the current performance trend to continue. But that’s not always the case. Different situations call for different formulas.
Here are a couple of common variations:
When past performance was an anomaly: Maybe you had a one-off issue that blew the budget early, but you're confident all future work will stick to the original plan. This is an optimistic view, so you’d better have a good reason for it.
- Formula: EAC = AC + (BAC - EV)
When schedule and cost are both spiralling: If you're behind schedule and over budget, and you expect these problems to persist, you can factor the Schedule Performance Index (SPI) into your forecast. This is common on projects where delays directly translate to higher costs.
- Formula: EAC = AC + [(BAC - EV) / (CPI * SPI)]
Pro Tip: Picking the right forecasting formula is all about professional judgement. You have to dig into why the variances happened. Was it a single bad estimate? Or is there a deeper issue with resource costs or team productivity? Your diagnosis will point you to the most accurate forecasting method.
This predictive capability is exactly why so many organisations swear by EVM. Statistical reviews have shown that projects using these techniques report around 25% better alignment with their milestones and budgets. This improvement has led to massive reductions in late deliveries and cost overruns over the years.
Ultimately, forecasting with earned value is about managing expectations and making smarter choices about your project management finances. It gives you the objective data you need to adjust the plan, shift resources, or reset stakeholder expectations long before things go completely off the rails.
Automating Earned Value Calculations with Freispace

Knowing the earned value formulas is one thing; feeding them with accurate, timely data is another beast entirely. The real-world challenge isn't the maths, but the endless grind of gathering data without drowning your team in manual tracking.
This is exactly where a modern project management tool bridges the gap. It can turn a complex, manual process into an automated, real-time feedback loop. Tools like freispace are built specifically to connect these dots for you, creating a single source of truth that powers all your earned value calculations.
Connecting Your Essential Data Sources
It all starts by linking the data streams that fuel your EVM metrics. Within freispace, this means integrating the core components of your project in one place.
For Actual Cost (AC): This is where integrated timesheets and expense tracking become indispensable. When your team logs hours or submits expenses against specific tasks, the platform automatically tallies the AC in real time. No more chasing down spreadsheets.
For Planned Value (PV): Your project plan, with its budgeted tasks and timeline, is your baseline. This is established directly within the Gantt chart, giving you a clear, fixed reference for what should have been done and spent by any given date.
When your cost and schedule data live in the same ecosystem, the platform does the heavy lifting, and the insights just flow.
Automating Progress Tracking for Earned Value
Let’s be honest, getting an objective measure of ‘% complete’ is often the messiest part of EVM. This is where tying everything back to your Gantt chart becomes a game-changer.
When tasks are marked as complete (or partially complete) in the project plan, freispace automatically calculates the corresponding Earned Value. This takes the subjective guesswork out of progress reporting once and for all.
By linking a task's completion status directly to its budgeted cost, the EV calculation becomes an objective, automated output of your team's daily work. This not only saves an incredible amount of time but, more importantly, it builds genuine trust in the data.
This automated approach ensures your performance metrics are always based on the very latest information, giving you an up-to-the-minute view of project health without ever needing to run a manual report.
Visualising Performance with Real-Time Dashboards
The final piece of the puzzle is turning all these numbers into something you can act on. Raw data has its place, but visual dashboards that show you trends over time are far more powerful for making quick, informed decisions.
Freispace generates live dashboards that display your key performance indicators—like CPI, SPI, and EAC—in a simple, easy-to-digest visual format. You can see at a glance if you're over budget, behind schedule, and where your project is forecast to end up. Having the ability to explore these project management platform features is a huge advantage.
This instant visual feedback helps project leads spot negative trends early, giving them a chance to take corrective action before a small variance becomes a major crisis. It makes sophisticated project controls accessible and, most importantly, a sustainable part of your studio’s daily workflow.
Avoiding the Common Pitfalls for Accurate EVM
Let's be honest, even the most elegant earned value formulas are useless if they're fed bad data. To really trust your metrics and calculate earned value with confidence, you have to be almost obsessive about the quality of your inputs. Get this wrong, and the whole analysis can be seriously misleading.
One of the most common issues I see is trying to work from a wobbly project baseline. If your initial plan is constantly shifting without any formal change control, your Planned Value (PV) becomes a moving target. It makes any meaningful comparison impossible.
My advice? Lock your baseline as soon as the initial planning phase is done and dusted. From that point on, any scope changes absolutely must go through a formal approval process, which should trigger a re-baselining of the project. This is the only way to maintain the integrity of your original plan as a benchmark for performance.
The '90% Complete' Syndrome
Ah, the classic pitfall. We’ve all been there. It's the notoriously subjective '90% complete' syndrome. Team members, usually with the best of intentions, will report a task as nearly finished for weeks on end. This creates a huge problem by inflating your Earned Value figure, effectively hiding schedule delays and giving everyone a false sense of security.
The only way to fight this is by setting up crystal-clear, objective completion criteria.
- Define 'Done': Create simple, binary definitions for when a task is actually finished. For a VFX shot, 'done' isn't when the artist thinks they're finished; it’s when the shot has passed final QC and been approved by the director. No grey areas.
- Use Milestones: Break down bigger, longer tasks into smaller milestones with tangible deliverables at each stage. Think 0%, 50%, and 100%. This forces a more realistic progress assessment rather than a vague guess.
Finally, and this is a big one, don't ever ignore poor data from timesheets or expenses. Inaccurate or delayed entries directly poison your Actual Cost (AC). When that happens, calculating a reliable Cost Performance Index (CPI) is simply out of the question. You have to enforce timely and precise tracking – it’s the very foundation of trustworthy EVM.
Got Questions About Earned Value?
Even after you get the hang of the formulas, running into weird edge cases or tricky scenarios is completely normal. Here are a few of the most common questions I hear from project managers just starting to wrap their heads around EVM.
How Do You Calculate Earned Value for Agile Projects?
This is a great question, and it really just requires a slight shift in perspective. When you're working in an agile environment, you're not tracking against a massive, months-long plan. Instead, you're measuring progress within the container of a single sprint or iteration.
It breaks down like this:
- Planned Value (PV): Forget the total project budget for a moment. Here, your PV is the total number of story points you planned to complete in that specific sprint.
- Earned Value (EV): This is the value of the work you actually finished. It’s the total story points for all user stories that are 100% complete and accepted by the end of the sprint.
- Actual Cost (AC): Simple enough – this is your team’s actual cost for the duration of the sprint.
This approach keeps EVM relevant and useful, tying it directly to the agile principle of delivering value in short, measurable cycles instead of getting lost in a Gantt chart.
What Is the Difference Between BAC and EAC?
This one trips people up all the time, but it’s a critical distinction between what you planned and what you now expect.
Budget at Completion (BAC) is your starting line. It's the original, formally approved budget for the entire project. Think of it as set in stone, unless there's an official change to the project's scope.
Estimate at Completion (EAC) is your forecast. It's a living, breathing number that answers the crucial question: "Based on our performance so far, what's the new finish line? What will this project actually cost us?"
I like to think of BAC as the destination you punch into your GPS before you leave. EAC is the updated arrival time the GPS gives you after you’ve hit unexpected traffic and a few detours. One is the plan, the other is the reality.
How Often Should I Calculate Earned Value for My Project?
There's no single right answer here—it really depends on the pulse of your project.
For a fast-paced, complex project that spans several months, running the numbers weekly is a smart move. It gives you just enough time to spot a worrying trend and steer the ship back on course before a small issue becomes a major problem.
On the other hand, for longer, more stable projects, a monthly reporting cycle is often plenty. You get the insights you need without getting bogged down in administrative overhead. The most important thing is to pick a rhythm and stick to it. Consistency is always more important than frequency.
Ready to put away the calculator and get these insights automatically? freispace pulls together your project plans, timesheets, and budgets to serve up live EVM dashboards. It's the easiest way to keep your post-production projects profitable and on schedule.
See how freispace can help you and explore the features for yourself.